
How Trade Dialer Works
Trade Dialer is your window into global stock markets. This guide explains how to read the dashboard and make the most of the tool.
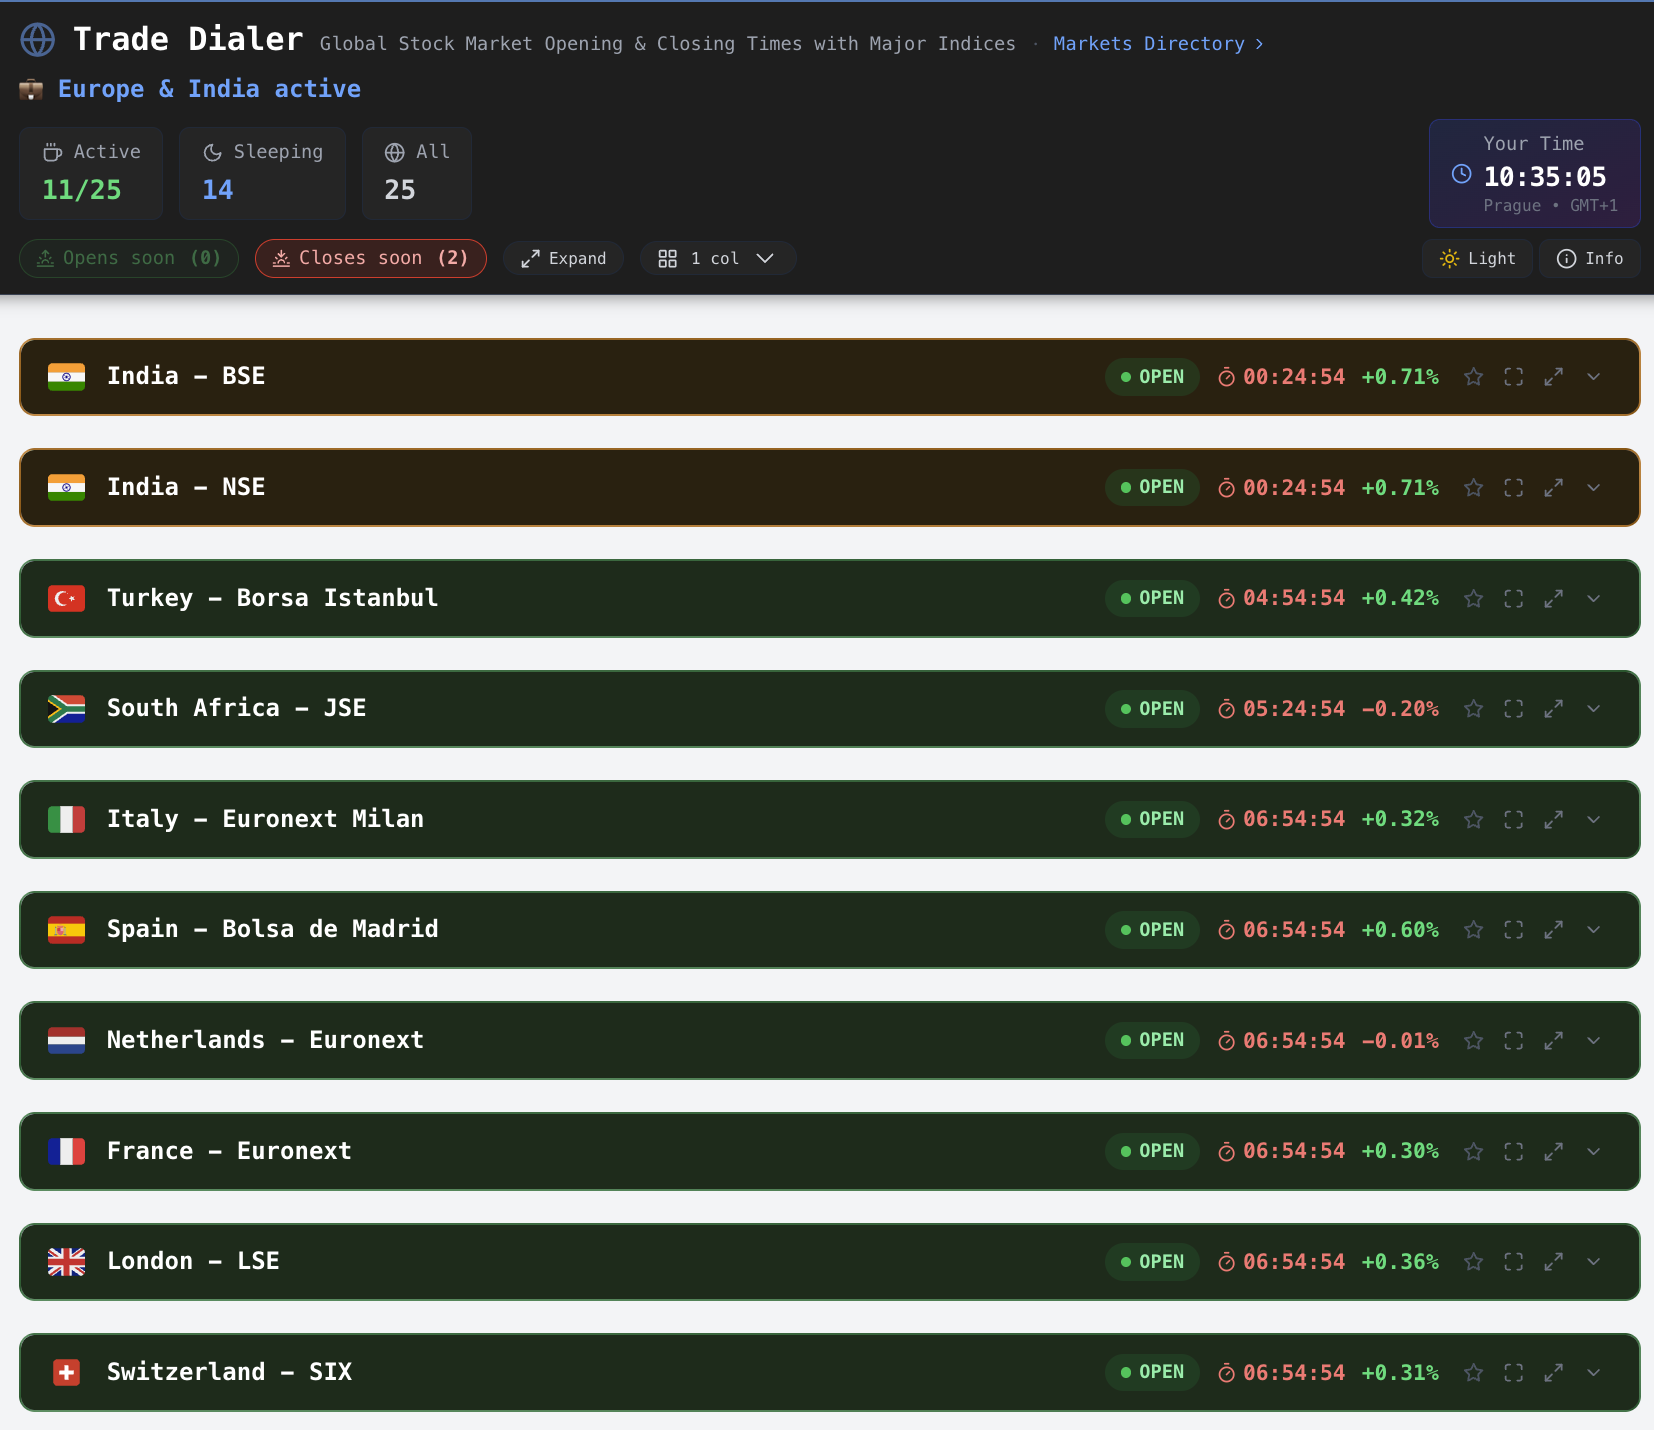
The Dashboard
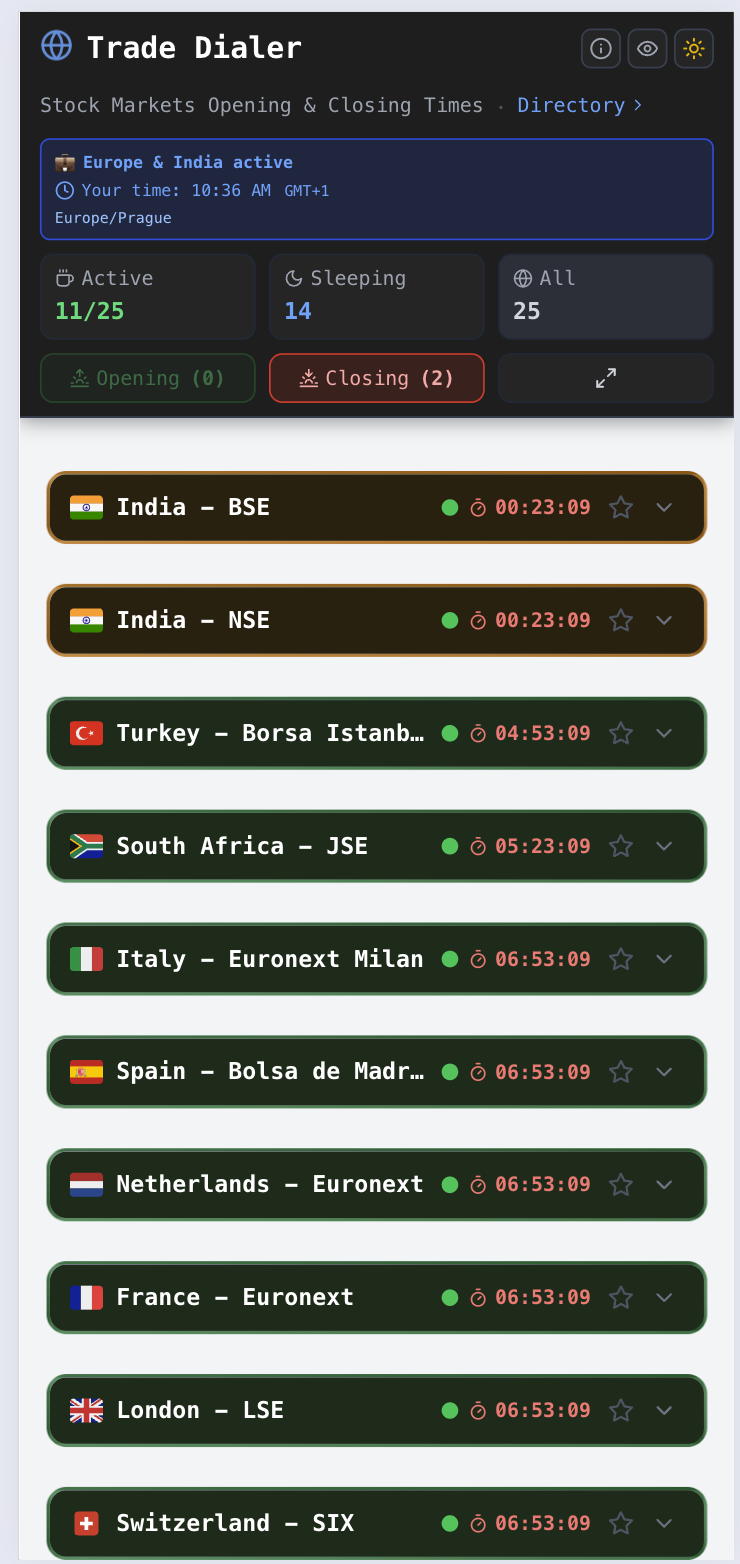
When you open Trade Dialer, you see a grid of market cards — one for each stock exchange we track.
Understanding Market Cards
Each card shows key information about a market:
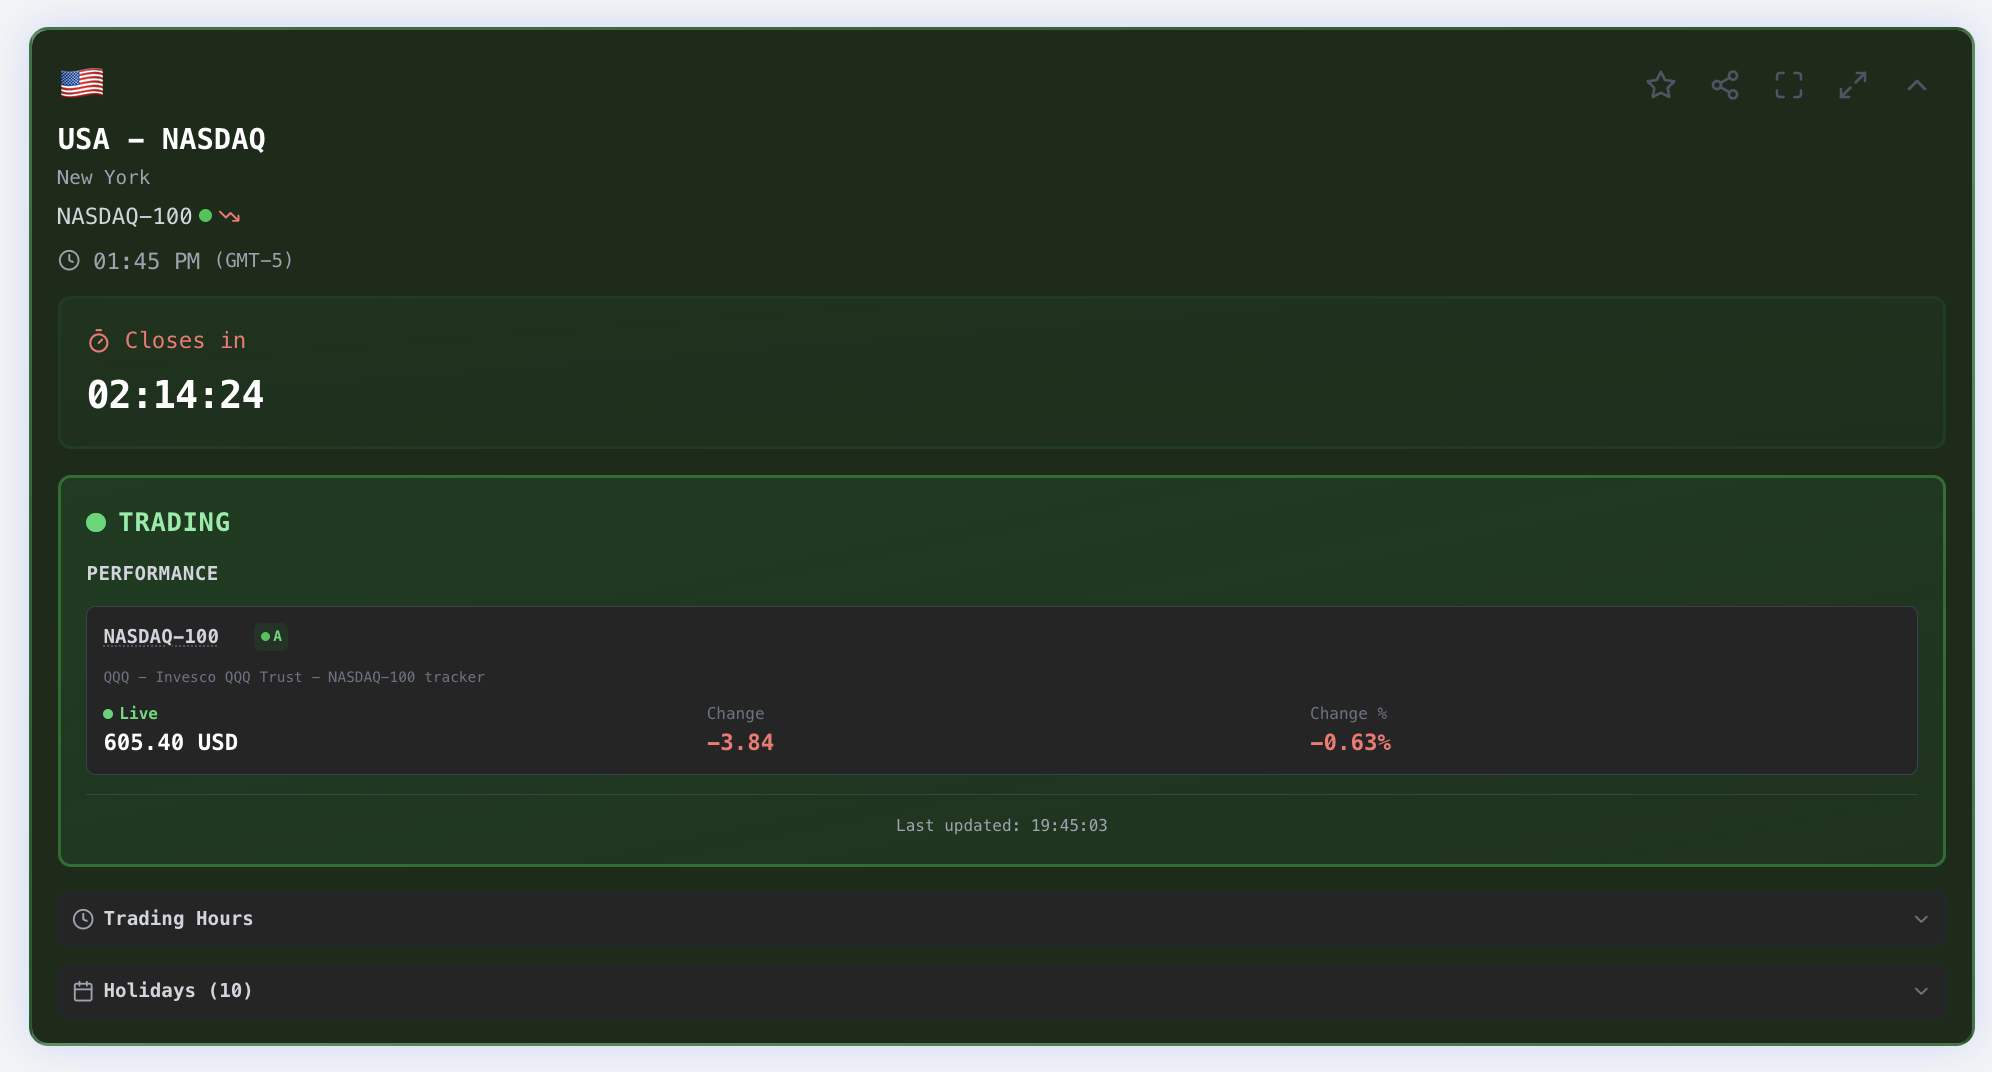
Card Elements
| Element | What It Shows |
|---|---|
| Flag & Name | Country and exchange name (e.g., "USA - NYSE") |
| Status | Whether the market is open, closed, or about to change |
| Countdown | Time until the market opens or closes |
| Index Values | Current prices for major indices (e.g., S&P 500) |
| Change | Daily gain/loss in points and percentage |
Market Status Colors
Trade Dialer uses colors to show market status at a glance:


| Color | Status | Meaning |
|---|---|---|
| Green | Open | Market is currently trading |
| Amber/Yellow | Closing Soon | Less than 1 hour until close |
| Blue | Opening Soon | Less than 1 hour until open |
| Gray | Closed | Market is closed (weekend, holiday, or outside hours) |
Countdown Timers
Every market shows a live countdown that updates in real-time:
When market is closed:
Opens in 2h 34m
Opens Monday 09:30
Opens in 3 days (holiday)
When market is open:
Closes in 4h 15m
Closes in 45m
The countdown automatically accounts for:
- Weekends (shows "Opens Monday")
- Holidays (skips to next trading day)
- Your local time (displays relative to you)
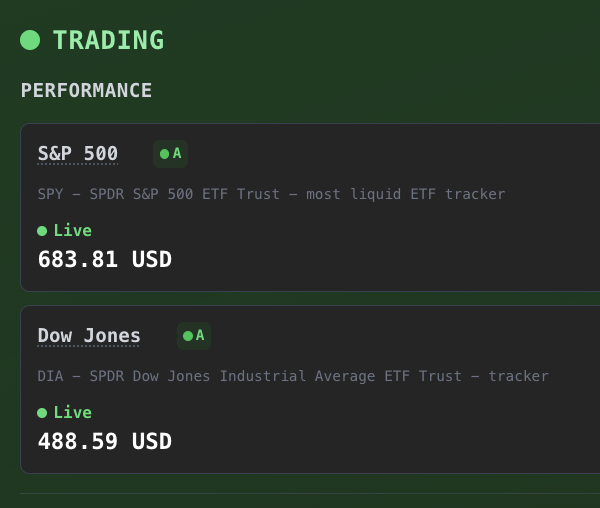
Index Values
For each exchange, we show the primary stock index:
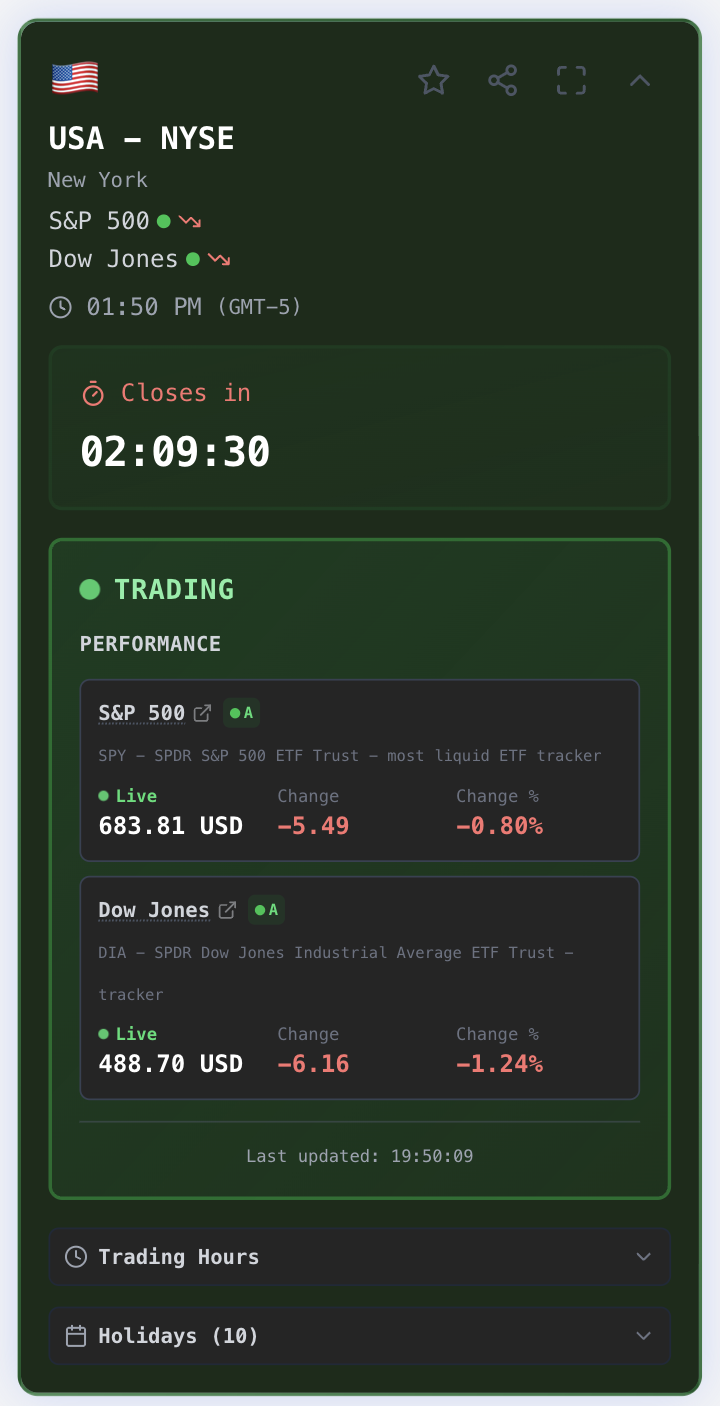
- Value — Current index level or ETF price
- Change — How much it moved today (in points)
- Percent — Percentage change for the day
- Green/Red — Indicates positive or negative movement
Data Freshness
Index data updates every 10 seconds for open markets (including those closing soon) and markets opening soon. Closed markets refresh every 5 minutes. When a market is closed, values shown are the last regular session closing price — extended hours data is not included.
Live Index Fallback
When US markets are closed but foreign markets are open, Trade Dialer automatically switches to live index data from Yahoo Finance. You'll see a blue Index Live indicator instead of green.
Learn more: Data Sources & Fallback
Data Transparency
Trade Dialer is transparent about where our data comes from. You may notice small badges next to some indices:
| Badge | Meaning |
|---|---|
| A | Excellent data source (direct ETF tracker) |
| B | Good proxy (country-level ETF) |
| C | Approximate proxy (regional ETF) |
Hover over the badge for more details about the specific data source.
Sorting & Filtering
By default, markets are sorted with open markets first. This puts the most relevant information at the top during trading hours.
Mobile Experience
Trade Dialer works on any screen size:
- Phone: Single-column layout, easy scrolling
- Tablet: Two-column grid or a custom grid setup, max 5
- Desktop: Multi-column grid with all markets visible, custom grid setup, max 5
Tips for Using Trade Dialer
1. Check Before Trading
Open Trade Dialer before placing any order to confirm the market is actually open. This is especially useful for international markets.
2. Plan Around Holidays
Markets close for local holidays that may not be on your calendar. Trade Dialer shows holiday names so you know why a market is closed.
3. Watch for Overlaps
The most active trading happens when multiple major markets are open simultaneously. See our Trading Hours Guide for overlap times.
4. Bookmark It
Keep Trade Dialer open in a browser tab or bookmark it for quick access throughout your trading day.
Frequently Asked Questions
Q: Why does my countdown show a different time than the exchange website? A: Trade Dialer converts all times to your local timezone. If you're in London looking at NYSE, we show when NYSE opens in London time, not New York time.
Q: Why is a market showing "Closed" during normal hours? A: It's likely a holiday. Check the holiday name displayed on the card.
Q: How often does the data update? A: Countdown timers update every second. Open markets (active and closes-soon) and markets opening soon refresh every 10 seconds. Closed markets refresh every 5 minutes.
Q: Is this data real-time? A: Index data is near-real-time with a 10-second refresh for open markets. Countdown timers are real-time.
Q: What values are shown when a market is closed? A: Values shown are the last regular session closing price. Extended hours data (pre-market and after-hours trading) is not included. Minor post-close corrections may occasionally update during the 5-minute refresh cycle.
Next: Markets Directory